BL14U
INFORMATION
Experimental Techniques
- Soft X-ray absorption spectroscopy (XAS)
- Soft X-ray magnetic circular dichroism spectroscopy (XMCD)
- Soft X-ray Imaging SXM, STXM (Advanced Measurement)
Overview
BL14U is a beamline that utilizes soft X-rays in the energy range of 200 to 1400 eV. Its twin helical undulators enables switching between left and right circularly polarized light in less than one minute. The monochromator employs a constant deviation type that combines a cylindrical mirror and a varied line-spacing plane grating, allowing for a nanofocused beam with a size of Φ100 nm or less using a Fresnel zone plate optics system.
As experimental equipment, a Soft X-ray Imaging (SXM) system equipped with Soft X-ray Magnetic Circular Dichroism (XMCD) measurement capabilities is installed. The SXM measurement methods support both transmission and total electron yield modes. Pre-treatment such as metal thin film deposition and surface cleaning by ion milling is also possible. By using this SXM, the elemental and chemical state distributions of various materials can be visualized at the sub-micron scale. Furthermore, combining it with XMCD measurements allows for the investigation of the magnetic properties of materials with high sensitivity.
Beam Characteristics
-
Energy
◆For non-focused beam: 200 – 1400 eV
◆For focused beam: 600 – 1400 eV
Note: Measurements may be possible below 400 eV, but the incident soft X-ray intensity decreases significantly, especially near the Carbon K-edge, due to reasons such as contamination of optical elements. -
Flux
For non-focused beam conditions: >3 x 10¹² photons/s
For focused beam conditions: >3 x 10⁹ photons/s
(Both are calculated values and depend on the energy and experimental conditions.) -
Beam size
For non-focused beam conditions: Φ several 100 µm (depends on the slit aperture settings)
For focused beam conditions: Φ 100 nm or less
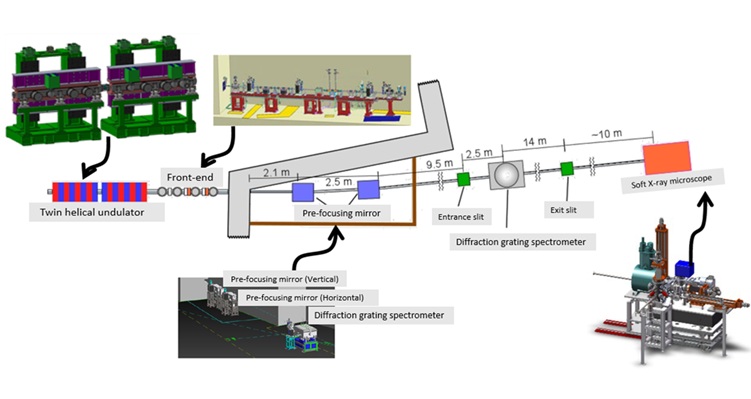
Light Source and Optics
A soft X-ray beam monochromatized by a grating spectrometer is available, using twin helical undulators with 33 poles and a period length of 56 mm in a tandem arrangement as the light source.
Slits are located upstream and downstream of the monochromator, which can be used to adjust the energy resolution and as a virtual point source in scanning imaging.
Experimental Station
- MethodsTransmission and Total Electron Yield
- Sample SizeMax. 10 mm x 10 mm (thickness: a few mm)
- About Samples
Transmission Method: Thin film samples transmissive to soft X-rays (~1 µm or less).
Total Electron Yield Method: Conductive solids (surface 5 nm). For non-conductive samples, metal thin film deposition is possible. Room temperature measurement. - Magnetic FieldMaximum 8T parallel to the beam axis.
Layout
Measurement Examples (Magnetic Imaging)
[Soft X-ray Imaging of Permanent Magnets]
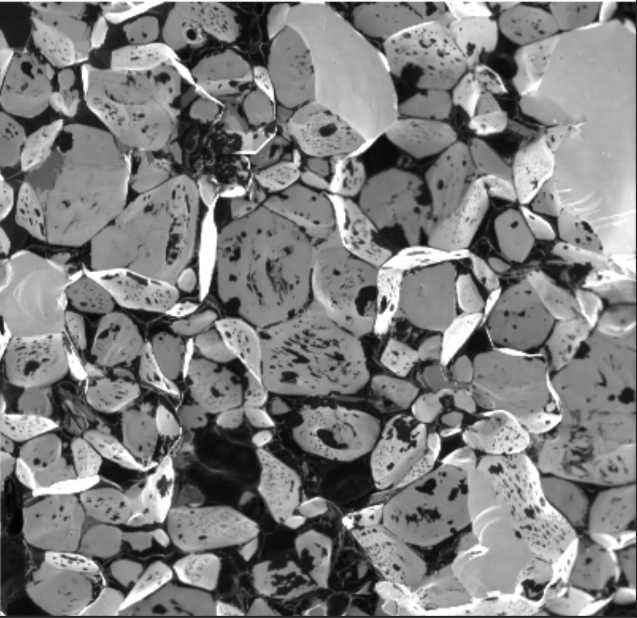
Soft X-ray Fe Absorption Contrast Image
- SampleCommercial Neodymium Magnet
- TreatmentThermal demagnetization
- X-ray Energy708 eV
- Observation60 μm × 60 μm
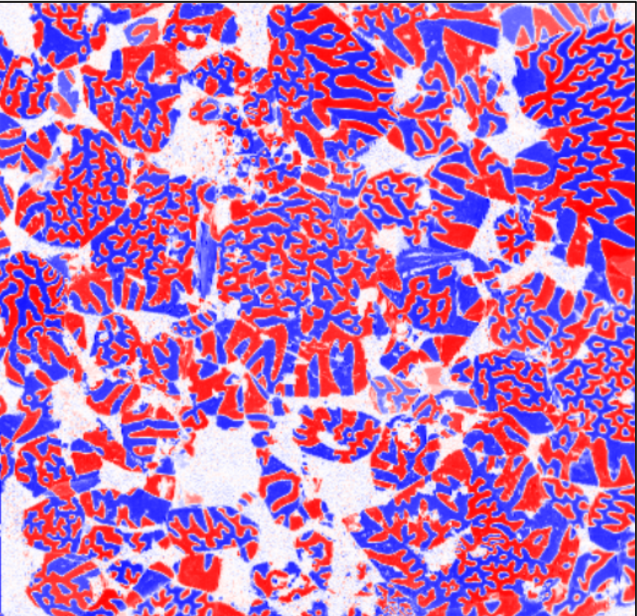
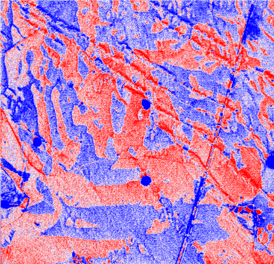
XMCD Contrast (Magnetic Domain Image)
- SampleCommercial Neodymium Magnet
- Measurement~12 min.
- X-ray Energy708 eV
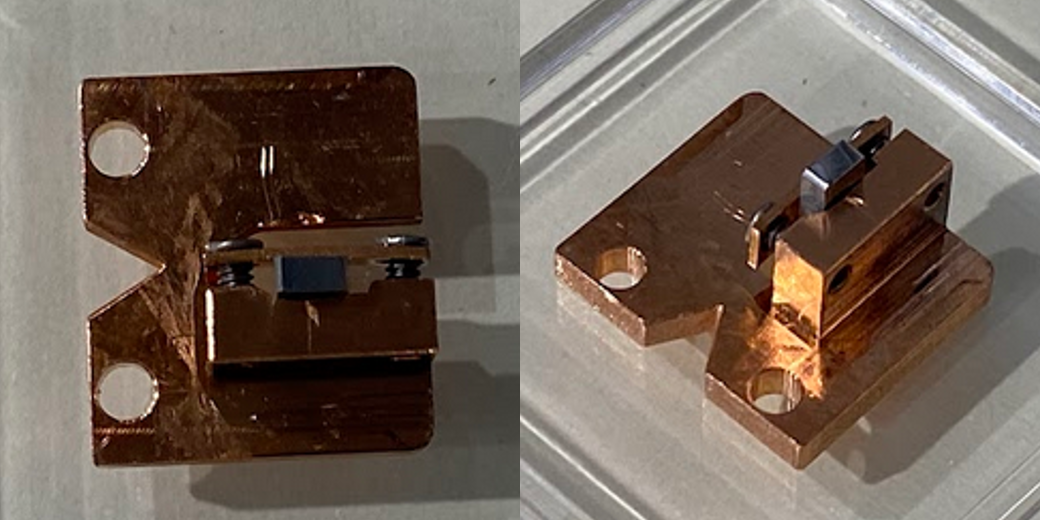
Sample Carriers
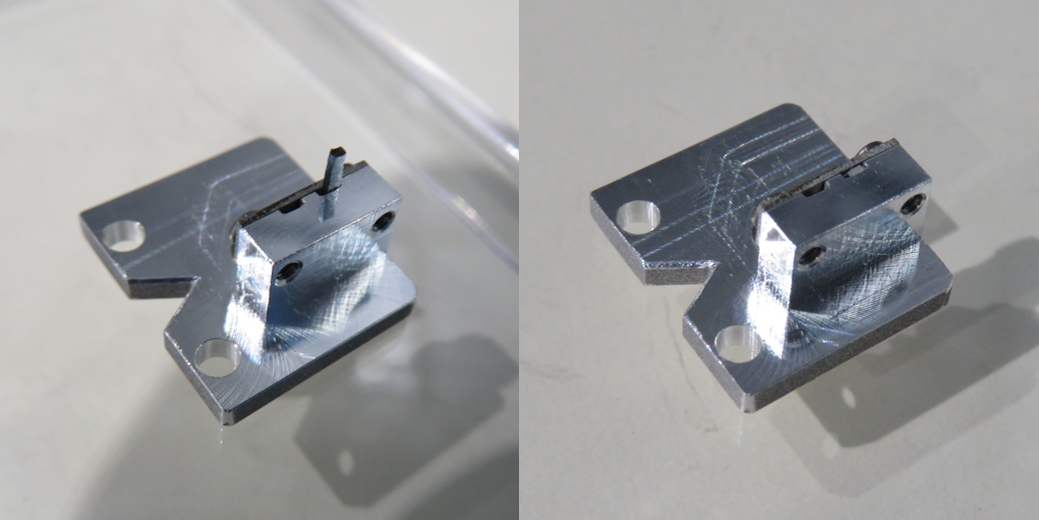
(Left: before fracture, Right: after fracture)
[Soft X-ray Imaging of Meteorite]
XMCD Contrast (Magnetic Domain Image)
- SampleGibeon meteorite
- Measurement10 min.
- X-ray Energy708 eV
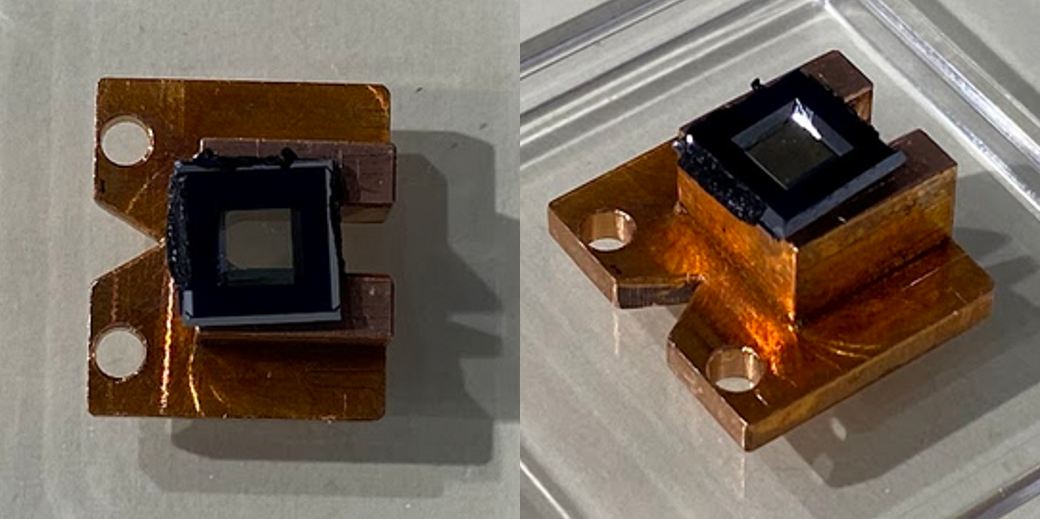
Sample Carriers
[Transmission Imaging]
- SampleYellow butterfly scale
- Measurement25 min.
- Links Butterfly Photo | Microscope Image
Sample Carriers
[Element-Specific Imaging]
Elemental maps can be obtained by acquiring images at the characteristic X-ray absorption edge energy and at an energy just before it, calculating the difference.
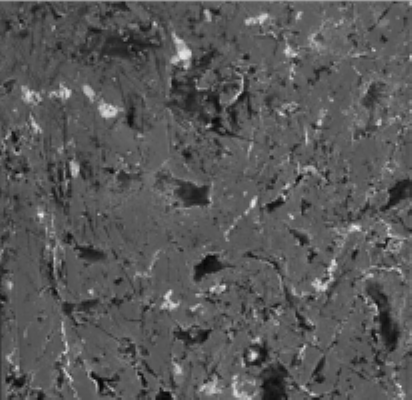
Coin (931 eV)
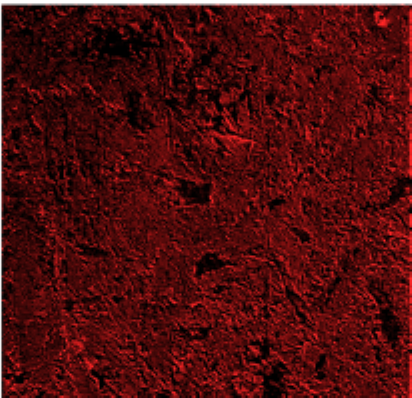
Elemental Map (Cu)
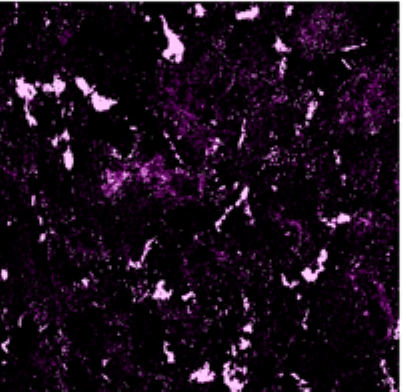
Elemental Map (Fe)
[Soft X-ray Imaging of Biological Samples]
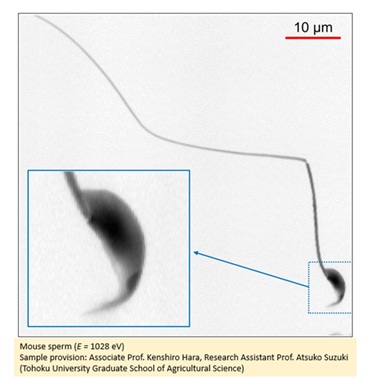
Mouse sperm
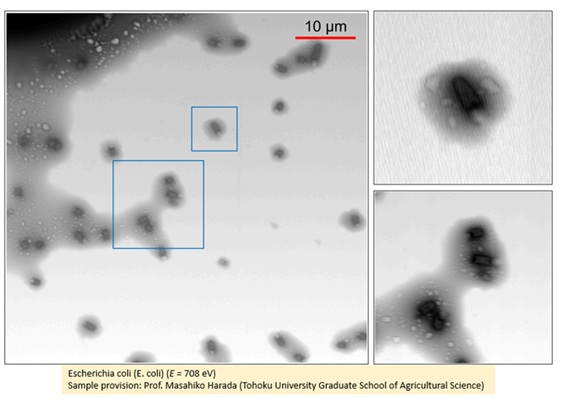
Escherichia coli (E. coli)
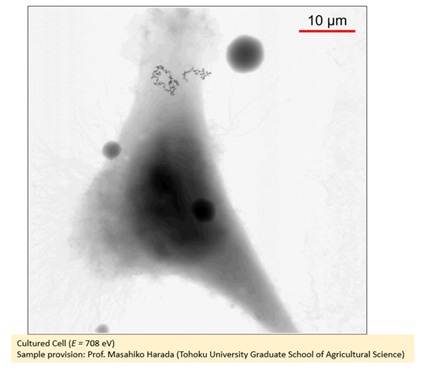
Cultured cells
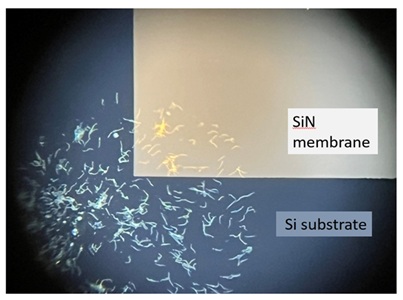
Stereomicroscopic Image of Sperm Sample
- Fixed sample dropped (~5 μL) onto SiN membrane and air-dried.
- 3 mm square, 100 nm thick SiN membrane used.
- Droplet placed near corners to prevent window damage.
- Coordinates set using visible light microscope.
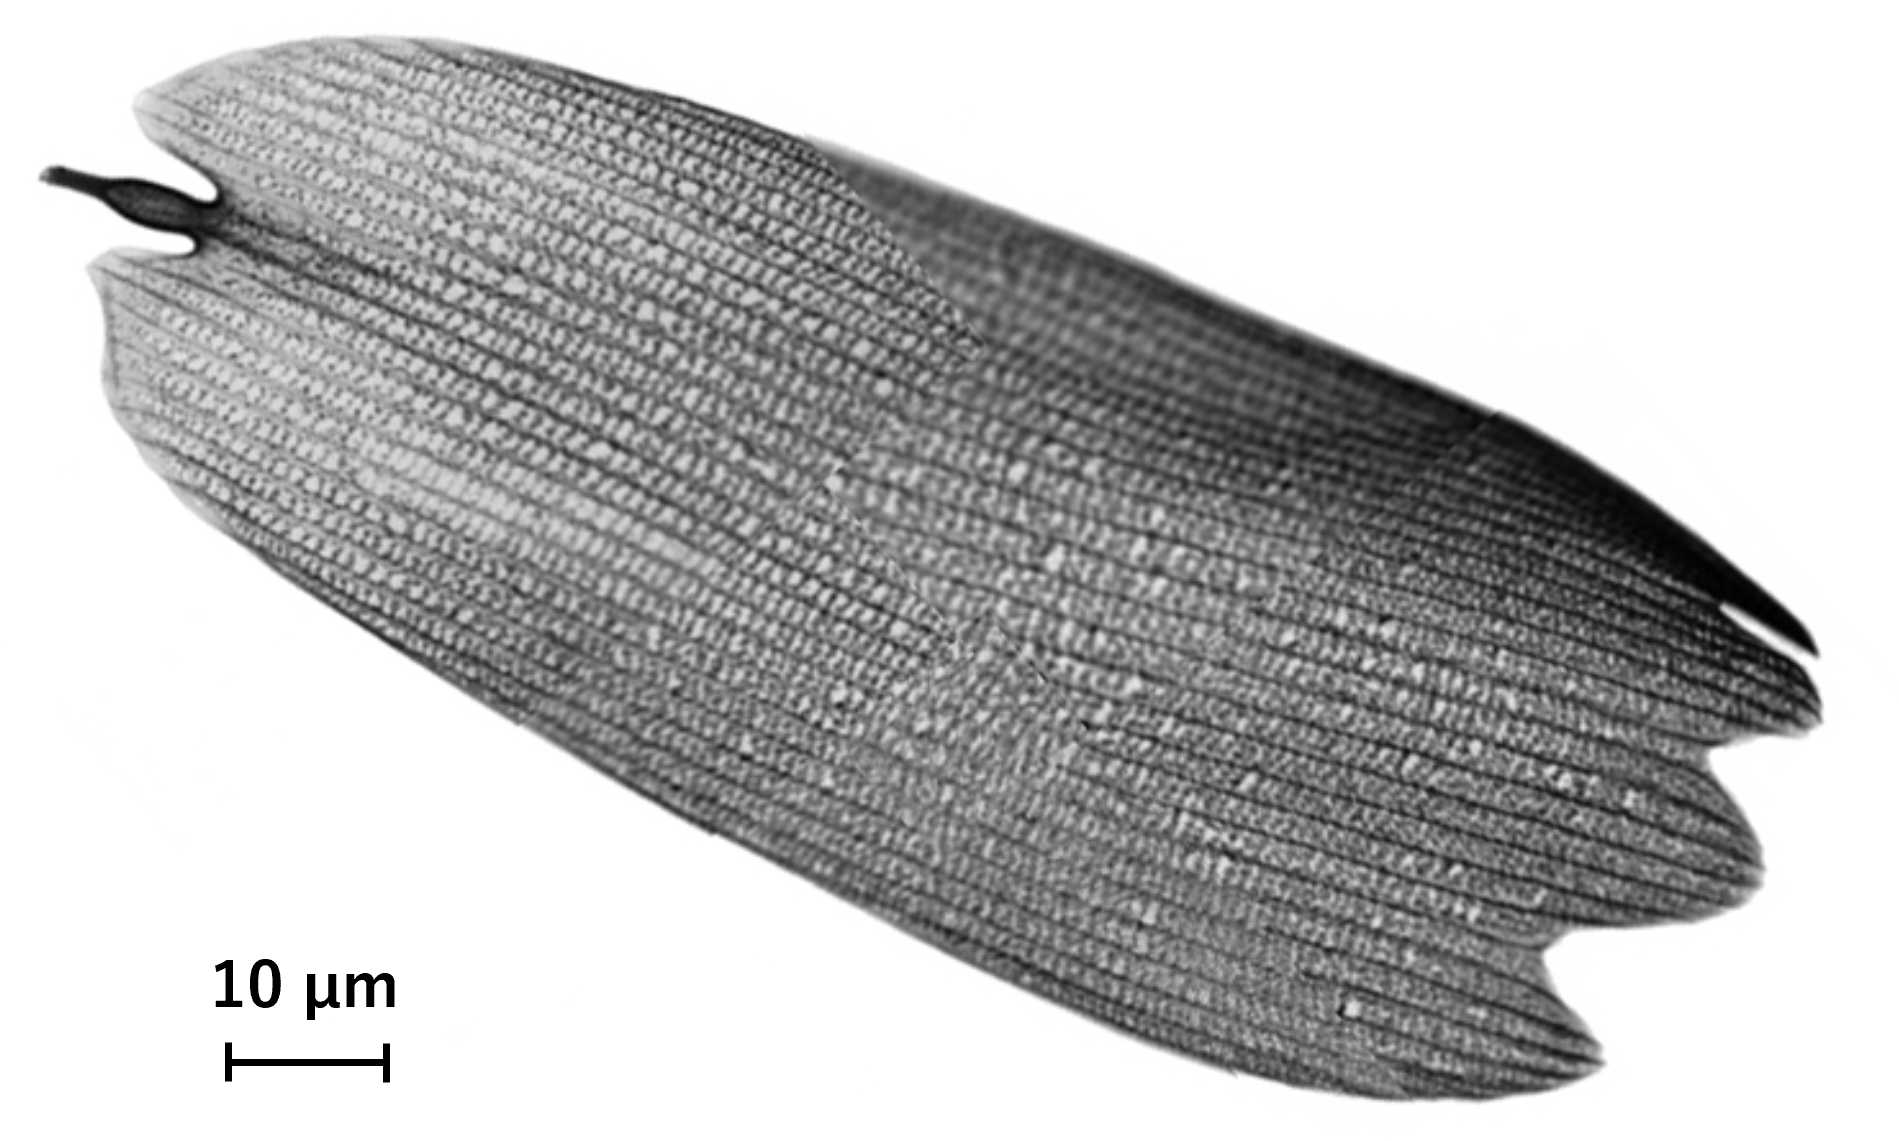
[Imaging of Diatom Fossils]
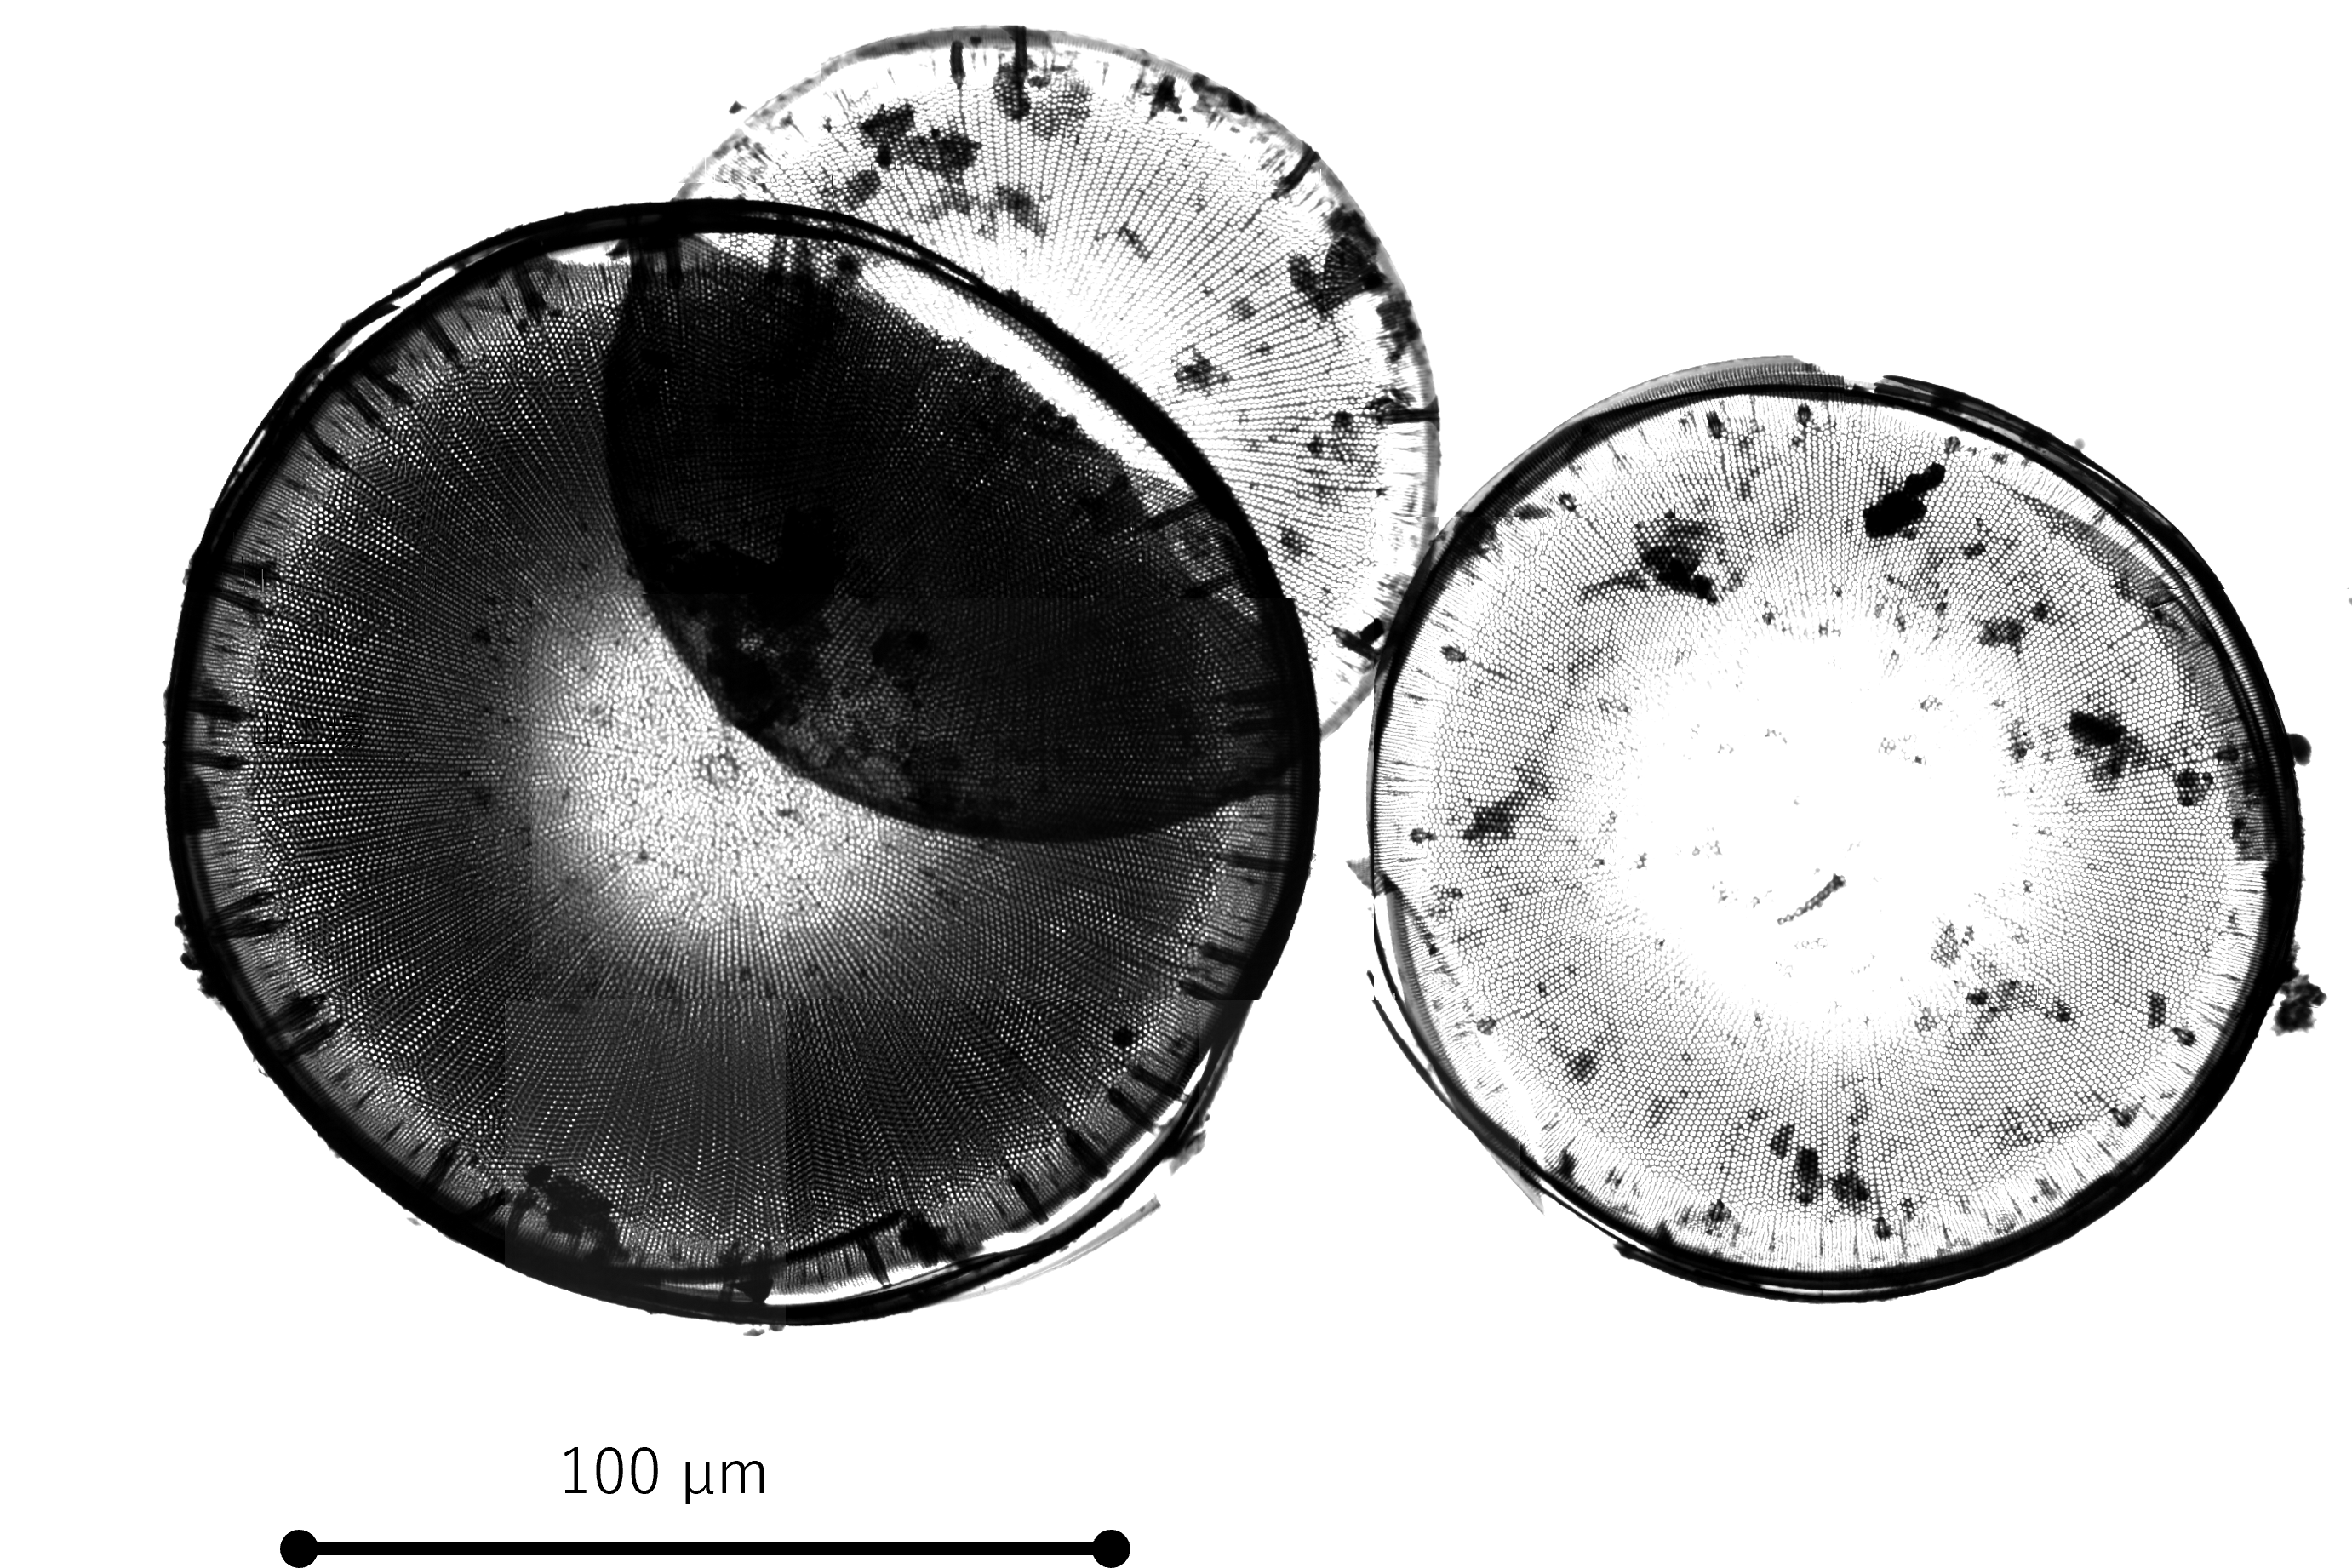
Overall view of diatom fossils
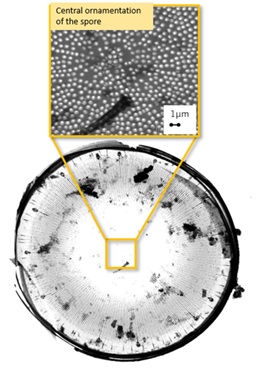
Central areolae
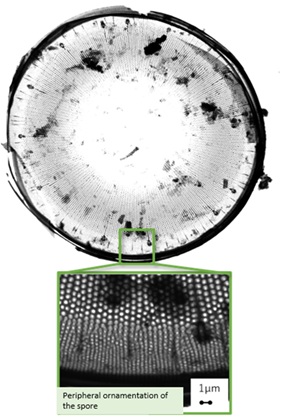
Marginal areolae
[MCD Spectrum]
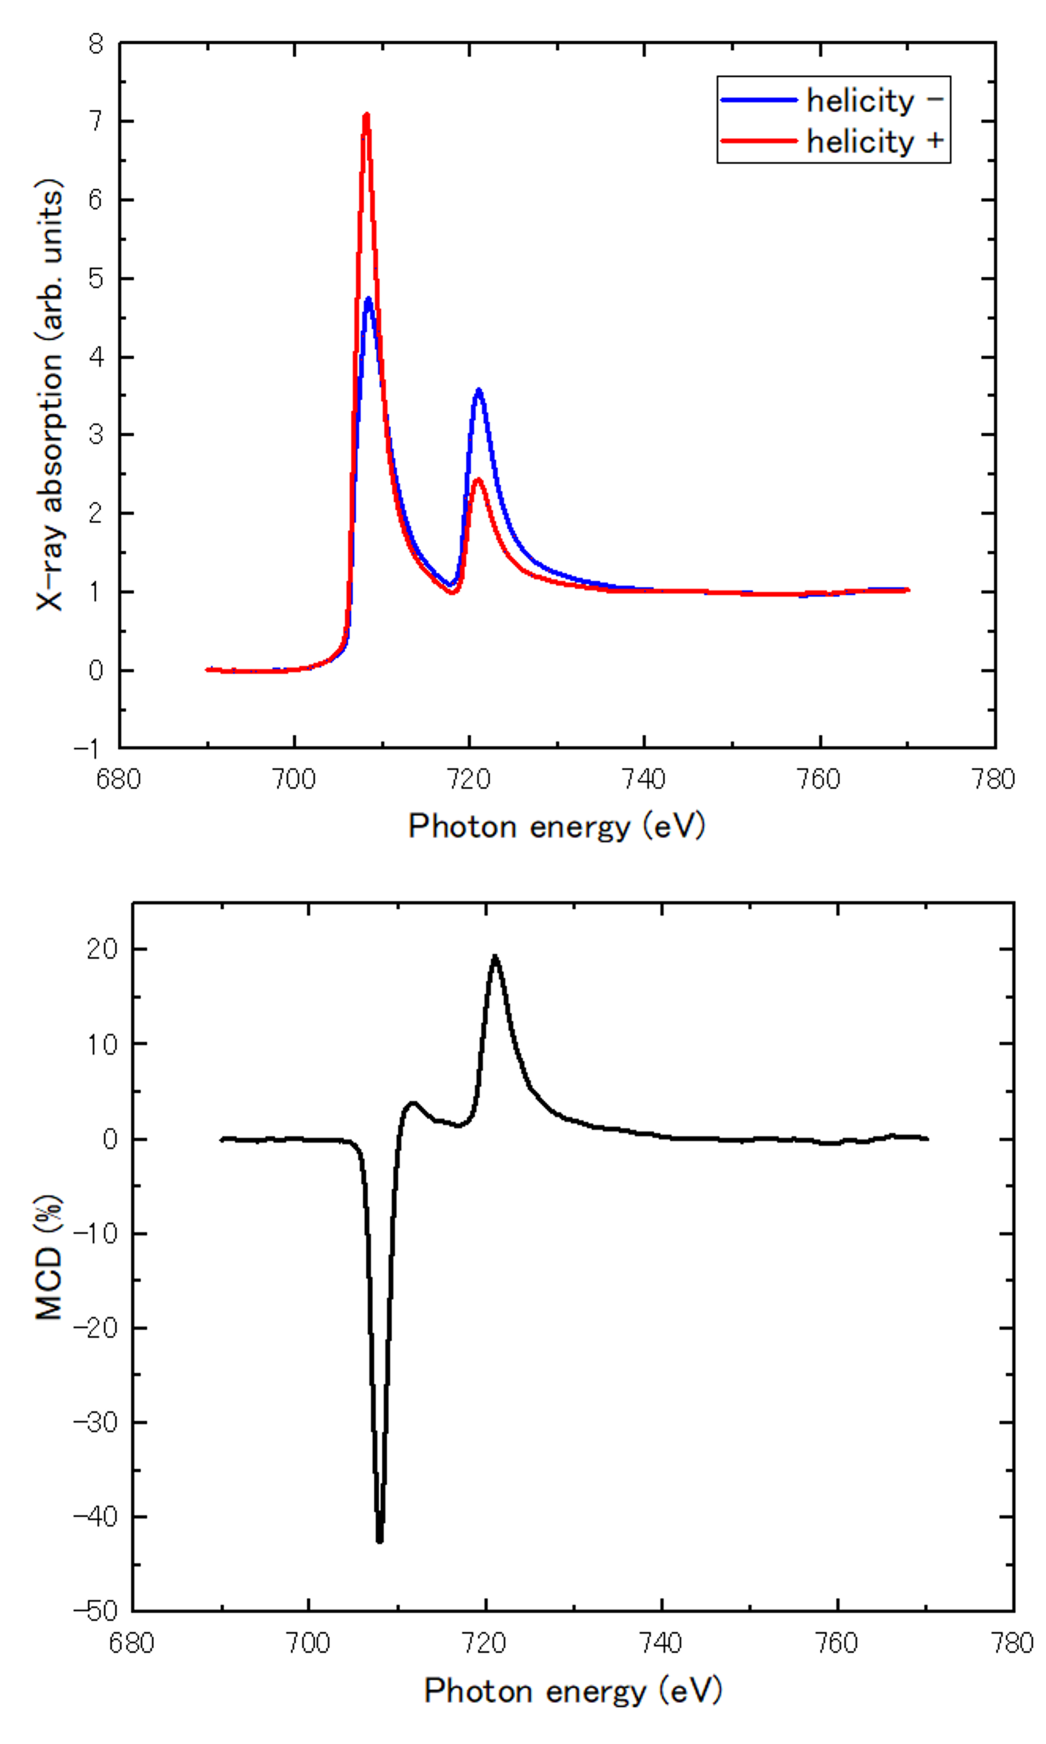
- SampleCommercial Neodymium Magnet
- MeasurementApprox. 40 minutes
- X-ray Energy~690 eV to 770 eV